
Page 42 - ATHM26_4
P. 42
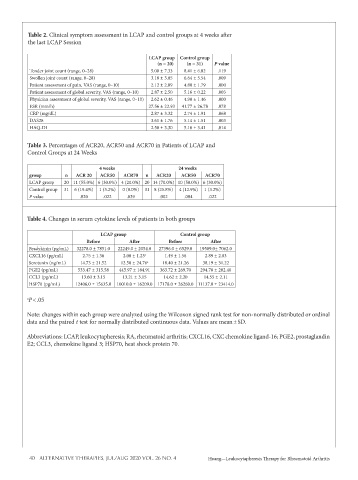
Table 2. Clinical symptom assessment in LCAP and control groups at 4 weeks after
          the last LCAP Session

                                                  LCAP group  Control group
                                                    (n = 20)  (n = 31)  P value
           Tender joint count (range, 0–28)       5.00 ± 7.33  8.41 ± 6.82  .119
           Swollen joint count (range, 0–28)      3.18 ± 3.05  6.64 ± 5.54  .009
           Patient assessment of pain, VAS (range, 0–10)  2.12 ± 2.09  4.80 ± 1.79  .000
           Patient assessment of global severity, VAS (range, 0–10)  2.87 ± 2.50  5.16 ± 0.22  .003
           Physician assessment of global severity, VAS (range, 0–10)  2.62 ± 0.46  4.90 ± 1.46  .000
           ESR (mm/h)                             27.56 ± 22.93  41.77 ± 26.78  .078
           CRP (mg/dL)                            2.87 ± 3.32  2.74 ± 1.91  .868
           DAS28                                  3.61 ± 1.76  5.14 ± 1.51  .003
           HAQ-DI                                 2.50 ± 3.30  5.16 ± 3.41  .014


          Table 3. Percentages of ACR20, ACR50 and ACR70 in Patients of LCAP and
          Control Groups at 24 Weeks


                                 4 weeks                   24 weeks
           group      n   ACR 20  ACR50  ACR70   n  ACR20   ACR50   ACR70
           LCAP group  20 11 (55.0%) 6 (30.0%) 4 (20.0%) 20 14 (70.0%) 10 (50.0%) 6 (30.0%)
           Control group  31  6 (19.4%)  1 (3.2%)  0 (0.0%)  31 8 (25.8%)  4 (12.9%)  1 (3.2%)
           P value         .020    .022   .039       .002    .004    .022


          Table 4. Changes in serum cytokine levels of patients in both groups

                                  LCAP group                Control group
                             Before        After        Before        After
          Bradykinin (pg/mL)  32278.0 ± 7851.0  22249.0 ± 2054.0  27396.0 ± 6529.0  19509.0± 7062.0
          CXCL16 (pg/mL)    2.75 ± 1.36  2.00 ± 1.23 a  1.49 ± 1.56  2.89 ± 2.83
          Serotonin (ng/mL)  14.73 ± 21.52  12.50 ± 24.76 a  18.40 ± 21.26  38.19 ± 31.22
          PGE2 (pg/mL)    533.47 ± 315.58  445.97 ± 184.91  363.72 ± 269.70  294.78 ± 202.40
          CCL3 (pg/mL)      13.60 ± 3.15  13.21 ± 3.15  14.62 ± 2.20  14.55 ± 2.11
          HSP70 (pg/mL)   12406.0 ± 15635.0  10010.0 ± 16209.0  17178.0 ± 26260.0 11137.0 ± 23414.0

          a P < .05

          Note: changes within each group were analyzed using the Wilcoxon signed rank test for non-normally distributed or ordinal
          data and the paired t test for normally distributed continuous data. Values are mean ± SD.

          Abbreviations: LCAP, leukocytapheresis; RA, rheumatoid arthritis; CXCL16, CXC chemokine ligand-16; PGE2, prostaglandin
          E2; CCL3, chemokine ligand 3; HSP70, heat shock protein 70.


           40   ALTERNATIVE THERAPIES, JUL/AUG 2020 VOL. 26 NO. 4    Huang—Leukocytapheresis Therapy for Rheumatoid Arthritis