
Page 54 - ATHM26_4
P. 54
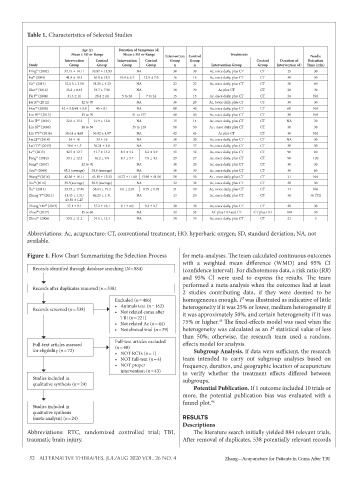
Table 1. Characteristics of Selected Studies


                            Age (y)     Duration of Symptoms (d)
                        Mean ± SD or Range  Mean ± SD or Range  Intervention  Control   Treatments    Needle
                      Intervention   Control   Intervention   Control   Group  Group  Control   Duration of   Retention
          Study         Group    Group   Group   Group    n     n     Intervention Group  Group  Intervention (d)  Time (min)
          Ding 19  (2002)  37.15 ± 14.11  35.87 ± 13.93  NA  30  30   Ac, once daily, plus CT  CT  25   30
          Fu 20  (2009)  41.8 ± 18.5  36.8 ± 18.5  10.4 ± 6.7  12.9 ± 7.0  16  16  Ac, once daily, plus CT  CT  30  30
          Ge 21  (2014)  32.0 6 ± 3.18  31.26 ± 4.25  NA  23    23    Ac, once daily, plus CT  CT  30   60
          Guo 22  (2016)  35.2 ± 8.43  33.7 ± 7.56  NA    30    30      Ac plus CT    CT       28       30
          He J 23  (2004)  31.3 ± 10  28.4 ± 14  5 to 20  7 to 24  15  15  Ac, once daily, plus CT  CT  28  NA
          He X 24  (2012)   12 to 70          NA          30    20   Ac, twice daily, plus CT  CT  30   30
          Hou 25  (2008)  42 ± 9.8/41 ± 8.8  40 ± 8.1  NA  80   40    Ac, once daily, plus CT  CT  60  NA
          Liu W 26  (2015)  15 to 70        31 to 137     40    40    Ac, once daily, plus CT  CT  30  NA
          Liu JP 27  (2010)  32.6 ± 15.3  31.9 ± 15.8  NA  15   14    Ac, once daily, plus CT  CT  NA   30
          Liu SS 28  (2006)  18 to 58       35 to 128     50    50   Ac , once daily plus CT  CT  30    30
          Liu YY 29  (2016)  38.61 ± 4.65  36.92 ± 4.87  NA  42  43     Ac plus CT    CT       30      NA
          Lu CJ 30  (2014)  34 ± 16  33 ± 16  NA          20    20    Ac, once daily, plus CT  CT  NA   30
          Lu TD 31  (2015)  39.6 ± 1.5  30.21 ± 1.8  NA   37    37    Ac, once daily, plus CT  CT  30   30
          Lv 32  (2013)  42.5 ± 12.7  41.7 ± 13.2  8.5 ± 4.2  8.2 ± 3.9  43  42  Ac, once daily, plus CT  CT  90  60
          Peng 33  (2010)  39.1 ± 12.2  40.2 ± 9.8  8.3 ± 3.7  7.9 ± 4.1  29  27  Ac, once daily, plus CT  CT  90  120
          Song 34  (2007)   12 to 70          NA          30    20    Ac, once daily, plus CT  CT  30   30
          Sun 35  (2009)  45.2 (average)  39.8 (average)  NA  30  30  Ac, once daily, plus CT  CT  30   60
          Wang 42  (2016)  42.36 ± 16.11  43.10 ± 15.33  14.72 ± 11.08  13.98 ± 11.56  50  50  Ac , once daily, plus CT  CT  21  NA
          Xie 36  (2016)  39.5(average)  36.9 (average)  NA  32  32   Ac, once daily, plus CT  CT  30   30
          Xu 37  (2014)  39.75 ± 17.86  38.64 ± 19.2  9.6 ± 2.03  8.79 ± 1.78  31  29  Ac, twice daily, plus CT  CT  14  NA
          Zhang Y 38  (2011)  41.43 ± 1.31/   46.25 ± 1.31  NA  43  20  Ac, once daily, plus CT  CT  30  30 (T2)
                      43.50 ± 1.27
          Zhang YM 39  (2013)  37.1 ± 9.1  37.2 ± 10.1  9.1 ± 4.0  9.3 ± 3.7  30  30  Ac, once daily, plus CT  CT  30  30
          Zhao 40  (2017)   15 to 60          NA          32    32    AC plus HO and CT  CT plus HO  180  30
          Zhou 41  (2006)  33.9 ± 11.2  34.1 ± 12.1  NA   30    30    Ac, once daily, plus CT  CT  21   3

          Abbreviations: Ac, acupuncture; CT, conventional treatment; HO, hyperbaric oxygen; SD, standard deviation; NA, not
          available.

          Figure 1. Flow Chart Summarizing the Selection Process  for meta-analyses. The team calculated continuous outcomes
                                                             with a weighted mean difference (WMD) and 95% CI
            Records identified through database searching (N = 884)  (confidence interval). For dichotomous data, a risk ratio (RR)
                                                             and 95% CI were used to express the results. The team
                                                             performed a meta-analysis when the outcomes had at least
            Records after duplicates removed (n = 538)
                                                             2 studies contributing data, if they were deemed to be
                                       Excluded (n = 466)    homogeneous enough. I² was illustrated as indicative of little
                                       •  Animals text (n = 162)  heterogeneity if it was 25% or lower, medium heterogeneity if
            Records screened (n = 538)  •  Not related coma after
                                        TBI (n = 221)        it was approximately 50%, and certain heterogeneity if it was
                                                                         45
                                       •  Not related Ac (n = 44)  75% or higher.  The fixed-effects model was used when the
                                       •  Not clinical trial (n = 39)  heterogeneity was calculated as an I² statistical value of less
                                                             than 50%; otherwise, the research team used a random,
                                       Full-text articles excluded
            Full-text articles assessed   (n = 48)           effects model for analysis.
            for eligibility (n = 72)                            Subgroup Analysis. If data were sufficient, the research
                                       •  NOT RCTs (n = 1)
                                       •  NOT full-text (n = 4)  team intended to carry out subgroup analyses based on
                                       •  NOT proper         frequency, duration, and geographic location of acupuncture
                                        intervention (n = 43)  to verify whether the treatment effects differed between
            Studies included in                              subgroups.
            qualitative synthesis (n = 24)
                                                                Potential Publication. If 1 outcome included 10 trials or
                                                             more, the potential publication bias was evaluated with a
                                                             funnel plot. 46
            Studies included in
            qualitative synthesis
            (meta-analysis) (n = 24)                         RESULTS
                                                             Descriptions
          Abbreviations: RTC, randomized controlled trial; TBI,   The literature search initially yielded 884 relevant trials.
          traumatic brain injury.                            After removal of duplicates, 538 potentially relevant records


           52   ALTERNATIVE THERAPIES, JUL/AUG 2020 VOL. 26 NO. 4          Zhang—Acupuncture for Patients in Coma After TBI