
Page 19 - ATHM26_4
P. 19
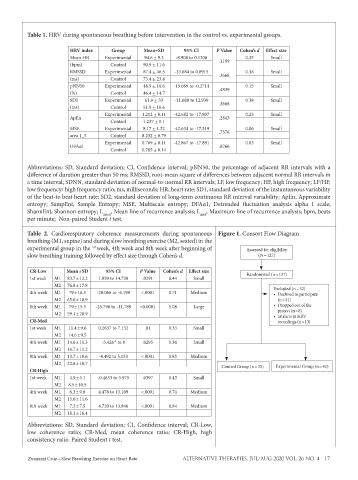
Table 1. HRV during spontaneous breathing before intervention in the control vs. experimental groups.


                        HRV index    Group      Mean+SD      95% CI     P Value  Cohen’s d  Effect size
                        Mean HR    Experimental  94.6 + 9.3  -8.908 to 0.1206  .1199  0.35  Small
                        (bpm)        Control    90.9 + 11.6
                        RMSSD      Experimental  87.4 + 46.5  -33.884 to 0.8915  .3668  0.38  Small
                        (ms)         Control    73.4 + 23.4
                        pNN50      Experimental  48.9 + 16.6  -19.669 to -0.2714  0.15    Small
                        (%)          Control    46.4 + 14.7              .4839
                        SD1        Experimental  61.9 + 33  -11.688 to 12.939  .3668  0.38  Small
                        (ms)         Control    51.9 + 16.6
                                   Experimental  1.212 + 0.11  -42.682 to -17.807  0.23   Small
                        ApEn                                             .2843
                                     Control    1.237 + 0.1
                        MSE        Experimental  8.17 + 1.22  -42.634 to -17.519  .7376  0.06  Small
                        area 1_5     Control   8.232 + 0.79
                                   Experimental  0.789 + 0.11  -42.867 to -17.891  0.03   Small
                        DFAα1                                            .8766
                                     Control   0.785 + 0.14

          Abbreviations: SD, Standard deviation; CI, Confidence interval; pNN50, the percentage of adjacent RR intervals with a
          difference of duration greater than 50 ms; RMSSD, root-mean square of differences between adjacent normal RR intervals in
          a time interval; SDNN, standard deviation of normal-to-normal RR intervals; LF, low frequency; HF, high frequency; LF/HF,
          low frequency/ high frequency ratio; ms, milliseconds; HR, heart rate; SD1, standard deviation of the instantaneous variability
          of the beat-to beat heart rate; SD2, standard deviation of long-term continuous RR interval variability; ApEn, Approximate
          entropy; SampEnt, Sample Entropy; MSE, Multiscale entropy; DFAα1, Detrended fluctuation analysis alpha 1 scale;
          ShannEnt, Shannon entropy; L mean , Mean line of recurrence analysis; L max , Maximum line of recurrence analysis; bpm, beats
          per minute;  Non-paired Student t test.

          Table 2.  Cardiorespiratory coherence measurements during spontaneous  Figure 1. Consort Flow Diagram
          breathing (M1, supine) and during slow breathing exercise (M2, seated) in the
          experimental group in the  week, 4th week and 8th week after beginning of   Assessed for eligibility
                               1st
          slow breathing training followed by effect size through Cohen’s d.         (N = 127)

           CR-Low      Mean ± SD    95% CI     P Value  Cohen’s d  Effect size    Randomized (n = 127)
           1st week  M1  83.7 ± 13.2  1.950 to 14.730  .0291  0.44  Small
                   M2  76.8 ± 17.8
           4th week  M1  79 ± 18.5  -20.066 to -6.198  <.0001  0.71  Medium               Excluded (n = 52)
                                                                                          •  Declined to participate
                   M2  65.6 ± 18.9                                                          (n = 31)
           8th week  M1  79 ± 15.5  -25.796 to -11.789  <0.0001  1.08  Large              •  Dropped out of the
                                                                                            project (n = 8)
                   M2  59.1 ± 20.9                                                        •  artifacts in HRV
           CR-Med                                                                           recordings (n = 13)
           1st week  M1  11.4 ± 9.6  0.2637 to 7.132  .01  0.33  Small
                   M2  14.6 ± 9.5
                                      -5
           4th week  M1  14.6 ± 11.3  -5.426  to 8  .0295  0.36  Small
                   M2  18.7 ± 11.2
           8th week  M1  13.7 ± 10.6  -4.492 to 5.133  <.0001  0.85  Medium
                   M2  22.8 ± 10.7                                                         Experimental Group (n = 42)
           CR-High                                                       Control Group (n = 33)
           1st week  M1  4.9 ± 5.1  -0.4653 to 5.975  .0397  0.43  Small
                   M2  8.5 ± 10.5
           4th week  M1  6.3 ± 9.8  4.476 to 13.109  <.0001  0.74  Medium
                   M2  15.6 ± 14.6
           8th week  M1  7.3 ± 7.5  4.720 to 13.846  <.0001  0.84  Medium
                   M2  18.1 ± 16.4
          Abbreviations: SD, Standard deviation; CI, Confidence interval; CR-Low,
          low coherence ratio; CR-Med, mean coherence ratio; CR-High, high
          consistency ratio. Paired Student t test.


          Zuanazzi Cruz—Slow Breathing Exercise on Heart Rate  ALTERNATIVE THERAPIES, JUL/AUG 2020 VOL. 26 NO. 4   17