
Page 21 - ATHM26_4
P. 21
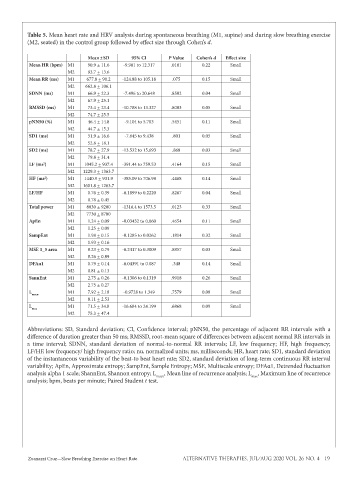
Table 5. Mean heart rate and HRV analysis during spontaneous breathing (M1, supine) and during slow breathing exercise
          (M2, seated) in the control group followed by effect size through Cohen’s d.

                              Mean ± SD     95% CI      P Value  Cohen’s d  Effect size
           Mean HR (bpm)  M1  90.9 + 11.6  -9.901 to 12.317  .0101  0.22    Small
                       M2     93.7 + 13.6
           Mean RR (ms)  M1  677.8 + 90.2  -124.88 to 105.18  .075  0.15    Small
                       M2    662.8 + 106.1
           SDNN (ms)   M1     66.9 + 22.3  -7.496 to 20.648  .8502  0.04    Small
                       M2     67.9 + 25.1
           RMSSD (ms)  M1     73.4 + 23.4  -10.788 to 13.327  .8003  0.05   Small
                       M2     74.7 + 25.5
           pNN50 (%)   M1     46.4 + 14.8  -9.104 to 5.703  .5451  0.11     Small
                       M2     44.7 + 15.3
           SD1 (ms)    M1     51.9 + 16.6  -7.645 to 9.438  .801   0.05     Small
                       M2     52.8 + 18.1
           SD2 (ms)    M1     78.7 + 27.9  -13.532 to 15.693  .868  0.03    Small
                       M2     79.8 + 31.4
           LF (ms )    M1    1045.2 + 937.4  -391.44 to 759.53  .4164  0.15  Small
               2
                       M2   1229.3 + 1363.7
           HF (ms )    M1    1440.9 + 931.9  -385.09 to 706.98  .4488  0.14  Small
                2
                       M2   1601.8 + 1263.7
           LF/HF       M1     0.76 + 0.39  -0.1899 to 0.2220  .8267  0.04   Small
                       M2     0.78 + 0.45
           Total power  M1   8030 + 9200  -1316.4 to 1573.5  .0123  0.33    Small
                       M2    7730 + 8700
           ApEn        M1     1.24 + 0.09  -0.03432 to 0.060  .4654  0.11   Small
                       M2     1.25 + 0.09
           SampEnt     M1     1.98 + 0.15  -0.1285 to 0.0262  .1814  0.32   Small
                       M2     1.93 + 0.16
           MSE 1_5 area  M1   8.23 + 0.79  -0.2417 to 0.3009  .8857  0.03   Small
                       M2     8.26 + 0.89
           DFAα1       M1     0.79 + 0.14  -0.04391 to 0.087  .348  0.14    Small
                       M2     0.81 + 0.13
           SannEnt     M1     2.75 + 0.26  -0.1306 to 0.1319  .9918  0.26   Small
                       M2     2.75 + 0.27
           L mean      M1     7.92 + 2.18  -0.9728 to 1.349  .7579  0.08    Small
                       M2     8.11 + 2.53
           L           M1     71.5 + 34.8  -16.684 to 24.199  .6868  0.09   Small
           max
                       M2     75.3 + 47.4
          Abbreviations: SD, Standard deviation; CI, Confidence interval; pNN50, the percentage of adjacent RR intervals with a
          difference of duration greater than 50 ms; RMSSD, root-mean square of differences between adjacent normal RR intervals in
          a time interval; SDNN, standard deviation of normal-to-normal RR intervals; LF, low frequency; HF, high frequency;
          LF/HF, low frequency/ high frequency ratio; nu, normalized units; ms, milliseconds; HR, heart rate; SD1, standard deviation
          of the instantaneous variability of the beat-to beat heart rate; SD2, standard deviation of long-term continuous RR interval
          variability; ApEn, Approximate entropy; SampEnt, Sample Entropy; MSE, Multiscale entropy; DFAα1, Detrended fluctuation
          analysis alpha 1 scale; ShannEnt, Shannon entropy; L mean , Mean line of recurrence analysis; L max , Maximum line of recurrence
          analysis; bpm, beats per minute; Paired Student t test.


          Zuanazzi Cruz—Slow Breathing Exercise on Heart Rate  ALTERNATIVE THERAPIES, JUL/AUG 2020 VOL. 26 NO. 4   19