
Page 20 - ATHM26_4
P. 20
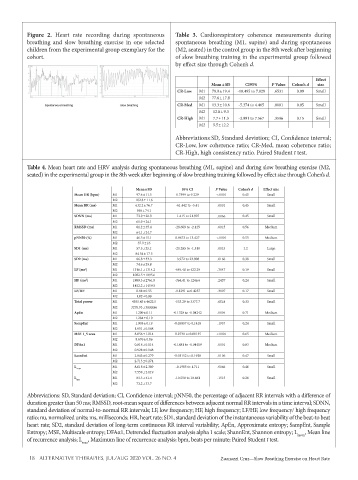
Figure 2.  Heart rate recording during spontaneous   Table 3.  Cardiorespiratory coherence measurements during
          breathing and slow breathing exercise in one selected   spontaneous breathing (M1, supine) and during spontaneous
          children from the experimental group exemplary for the   (M2, seated) in the control group in the 8th week after beginning
          cohort.                                         of slow breathing training in the experimental group followed
                                                          by effect size through Cohen’s d.


                                                                                                        Effect
                                                                      Mean ± SD  CI95%    P Value  Cohen’s d  size
                                                           CR-Low  M1  78.9 ± 19.4  -10.495 to 7.828  .6531  0.09  Small
                                                                  M2  77.6 ± 17.8
                                                           CR-Med  M1  13.3 ± 10.6  -5.374 to 4.465  .8001  0.05  Small
                                                                  M2   12.8 ± 9.3
                                                           CR-High  M1  7.7 ± 11.3  -3.991 to 7.567  .3596  0.15  Small
                                                                  M2   9.5 ± 12.2
                                                          Abbreviations: SD, Standard deviation; CI, Confidence interval;
                                                          CR-Low, low coherence ratio; CR-Med, mean coherence ratio;
                                                          CR-High, high consistency ratio. Paired Student t test.

          Table 4. Mean heart rate and HRV analysis during spontaneous breathing (M1, supine) and during slow breathing exercise (M2,
          seated) in the experimental group in the 8th week after beginning of slow breathing training followed by effect size through Cohen’s d.

                                             Mean ± SD      95% CI     P Value  Cohen’s d  Effect size
                         Mean HR (bpm)  M1    97.6 ± 11.5  0.7599 to 9.229  <.0001  0.45  Small
                                      M2     102.8 ± 11.6
                         Mean RR (ms)  M1    632.2 ± 76.7  -61.442 to -5.41  .0001  0.45  Small
                                      M2      598 ± 74.1
                         SDNN (ms)    M1      73.9 ± 28.9  -1.415 to 21.907  .0066  0.45  Small
                                      M2      61.9 ± 24.1
                         RMSSD (ms)   M1      81.2 ± 35.4  -28.609 to -2.125  .0015  0.56  Medium
                                      M2      64.1 ± 24.7
                         pNN50 (%)    M1      46.5 ± 15.1  0.8673 to 13.427  <.0001  0.55  Medium
                                      M2      37.9 ± 16
                         SD1 (ms)     M1      57.5 ± 25.1  -20.285 to -1.510  .0015  1.2  Large
                                      M2     84.54 ± 17.5
                         SD2 (ms)     M1      86.8 ± 33.3  -3.972 to 23.908  .0166  0.38  Small
                                      M2      74.6 ± 29.8
                         LF (ms 2 )   M1    1316.1 ± 1314.2  -684.40 to 422.29  .3047  0.19  Small
                                      M2    1082.5 ± 1095.6
                         HF (ms 2 )   M1    1989.3 ± 2761.9  -364.41 to 1246.6  .2437  0.24  Small
                                      M2    1452.2 ± 1459.5
                         LF/HF        M1      0.88 ± 0.55  -0.1291 to 0.4257  .3907  0.17  Small
                                      M2      1.02 ± 0.99
                         Total power  M1    4555.43 ± 4622.5  -533.29 to 3377.7  .0518  0.33  Small
                                      M2    3270.93 ± 3000.86
                         ApEn         M1     1.209 ± 0.11  -0.1328 to -0.04242  .0004  0.71  Medium
                                      M2     1.284 ± 0.10
                         SampEnt      M1     1.905 ± 0.19  -0.05897 to 0.1418  .1957  0.24  Small
                                      M2     1.951 ± 0.188
                         MSE 1_5 area  M1    8.056 ± 1.014  -0.2730 to 0.09135  <.0001  0.65  Medium
                                      M2     8.676 ± 0.86
                         DFAα1        M1     0.818 ± 0.114  -0.1481 to -0.04419  .0001  0.83  Medium
                                      M2     0.928 ± 0.148
                         SannEnt      M1     2.843 ± 0.279  -0.03152 to 0.1928  .0106  0.47  Small
                                      M2     2.713 ± 0.274
                                      M1     8.618 ± 2.389  -0.1985 to 1.711  .0066  0.46  Small
                         L mean
                                      M2     7.558 ± 2.119
                                      M1      83.3 ± 41.4  -10.550 to 18.661  .1515  0.26  Small
                         L max
                                      M2      73.2 ± 33.7
          Abbreviations: SD, Standard deviation; CI, Confidence interval; pNN50, the percentage of adjacent RR intervals with a difference of
          duration greater than 50 ms; RMSSD, root-mean square of differences between adjacent normal RR intervals in a time interval; SDNN,
          standard deviation of normal-to-normal RR intervals; LF, low frequency; HF, high frequency; LF/HF, low frequency/ high frequency
          ratio; nu, normalized units; ms, milliseconds; HR, heart rate; SD1, standard deviation of the instantaneous variability of the beat-to beat
          heart rate; SD2, standard deviation of long-term continuous RR interval variability; ApEn, Approximate entropy; SampEnt, Sample
          Entropy; MSE, Multiscale entropy; DFAα1, Detrended fluctuation analysis alpha 1 scale; ShannEnt, Shannon entropy; L mean , Mean line
          of recurrence analysis; L , Maximum line of recurrence analysis; bpm, beats per minute; Paired Student t test.
                            max

           18   ALTERNATIVE THERAPIES, JUL/AUG 2020 VOL. 26 NO. 4        Zuanazzi Cruz—Slow Breathing Exercise on Heart Rate